Gantt Chart web part
About the Gantt Chart Web Part
The Gantt Chart web part is a modern Gantt chart with interactive features. Currently there are two types of Gantt Chart, the Project Gantt and the Project Task Hierarchy Gantt.
Project Gantt
Project Gantt charts use the Project Cache for fast cross-site project level reporting. This is intended to eventually replace BrightWork Reporter Gantt Charts over time.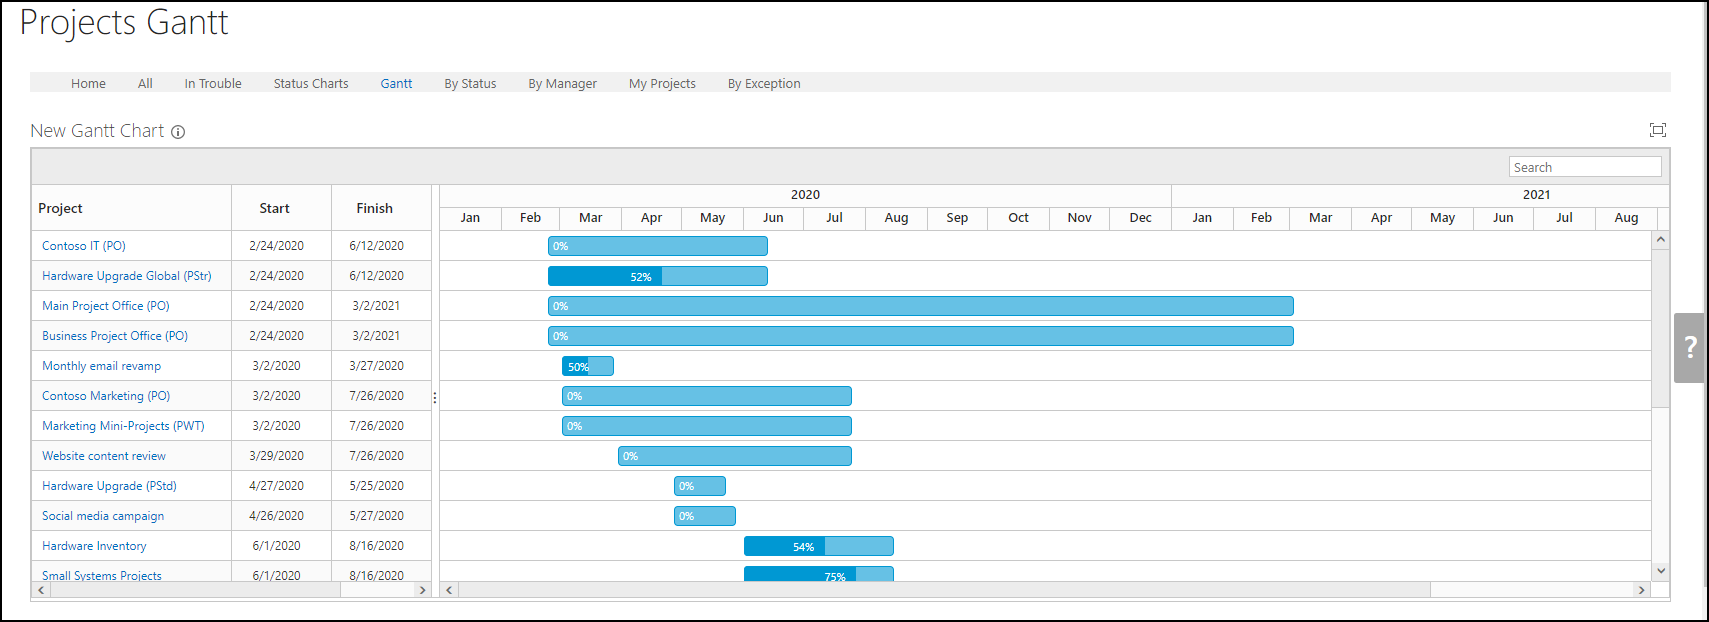
Project Task Hierarchy Gantt
Project Task Hierarchy Gantt charts use the Project Tasks list for project task reporting. This is intended to eventually replace List Gantt View web part over time.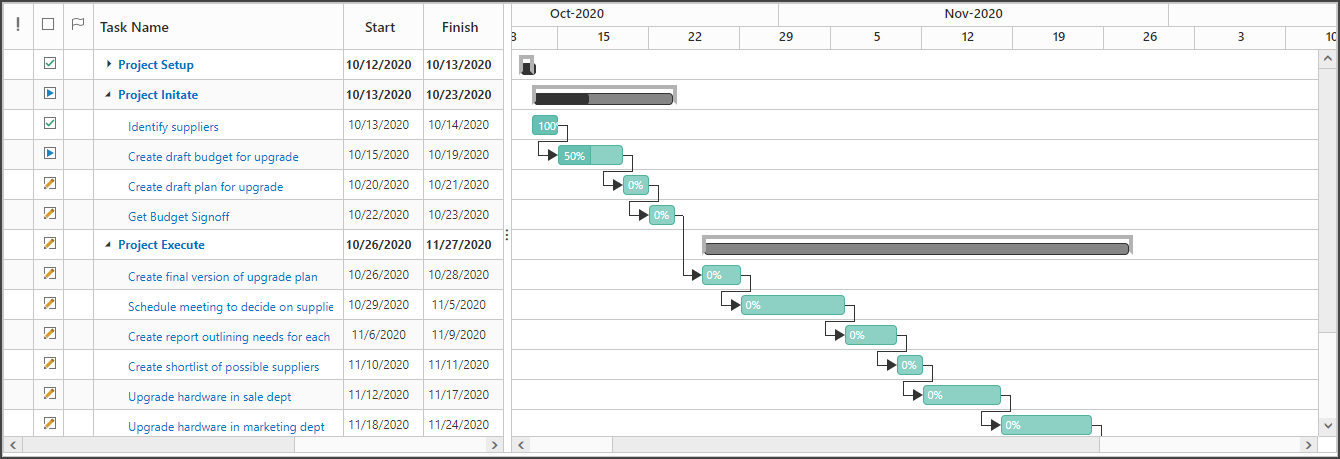
Note: For the best Gantt experience we recommend using a modern browser. You will experience fewer features and may experience unexpected behaviors using Internet Explorer, especially with larger numbers of items.
Using the Gantt Chart Web Part
All Gantts
The Gantt Chart web part supports the following:
- Column widths can be dragged to expand or narrow the column.
- Column splitter can be dragged left and right to hide or show columns.
- Information icon
 to view report configuration.
 - An open bracket to represent an item missing a start or finish date.
 Refresh: Refreshes Gantt chart data.
 Zoom In: Narrows in on a date range moving from Years and Quarters, to Quarters and Months, to Months and Weeks, to Weeks and Days.
 Zoom Out: Widens out from a date range moving from Weeks and Days, to Months and Weeks, to Quarters and Months, to Years and Quarters.
- A Gantt Search box. Search results will display relevant items, including summary tasks, and the hierarchy they are in.
-
Sort columns by clicking on column headings. Ctrl-Click a column heading for multi-column sorting. Refresh the Gantt to return to the default sort order.
Note: Sorting by icons is not recommended as it may not work as expected.
Note:
Search results will include values from columns that are hidden behind the Gantt's chart section, e.g., the Predecessors column.
Search results will include icon choice values such as those related to status and priority.
Do not include column value formatting such as '$' or '%' in search terms, and dates should be searched using the same format as this example: Mar 22 2023.
Yes/No columns are not supported.
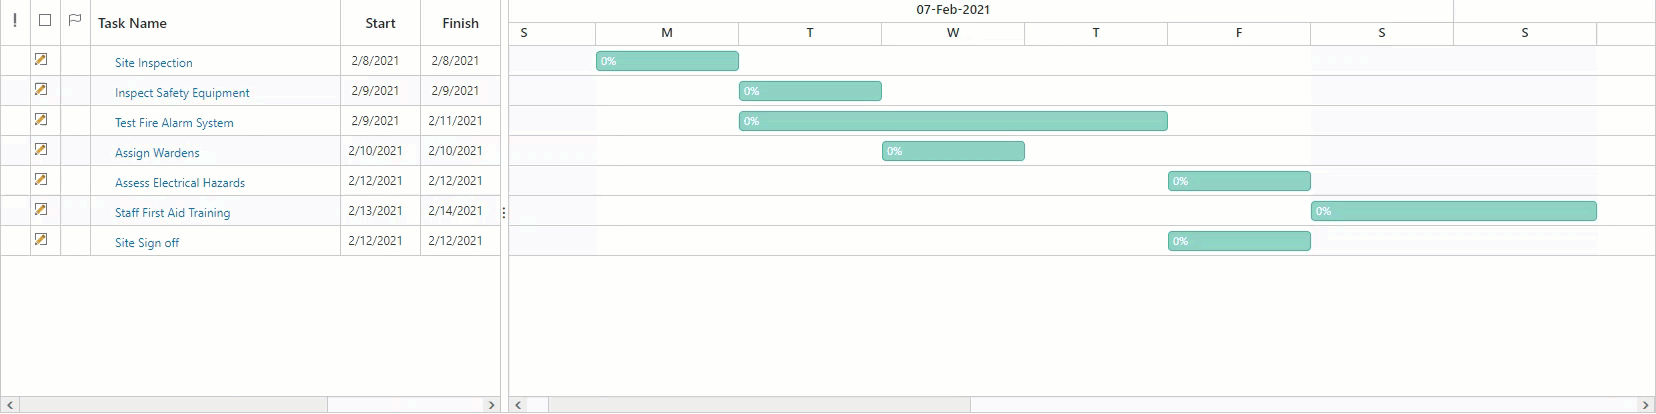
Project Task Hierarchy Gantt
Project Task Hierarchy reporting in the Gantt Chart web part also supports the following:
- Grey 'Frame' indicator for actual dates for the Summary Task.
- Black diamond indicator for a milestone task. A task can be set as a milestone task by checking the Milestone yes/no box when editing the item. A task will also be set as a milestone if Scheduling is turned on in the Project Tasks list and the task has a duration of 0 days, or its Start date is later than its Finish date.
-
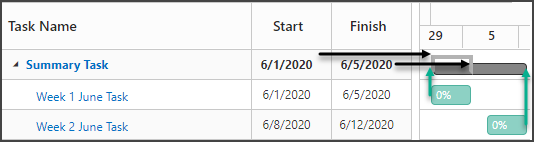
Summary bar to reflect the tasks rollup dates for the Summary Task. In this example, the black arrows point at the 'Frame' which is displaying the dates in the Summary Task.
The green arrows show the start and finish dates for the Summary Task and is calculated from its sub-tasks:
-
Summary Tasks can be expanded and collapsed for ease of use, either individually or using the Expand All and Collapse All actions.
Note: Predecessor links are not displayed if the Predecessor is a Summary Task.
Editing Project Tasks Using the Gantt Chart
Project Task Hierarchy Gantt
It is possible to modify Tasks in a Gantt Chart if the Enable Editing option is set on the Gantt Settings page.
The Gantt Chart web part supports the following:
- % Complete can be updated by dragging the % Complete bar directly in the Gantt Chart; task status will update accordingly.
- Finish-to-Start predecessor relationships between tasks can be established by dragging an arrow between the items directly in the Gantt Chart. Subsequent changes, however, will need to be made by directly editing the tasks. Note the Predecessor column must not be hidden on the Project Tasks list (for example, in the Project Lite template by default), otherwise this Predecessor link functionality will be automatically disabled. To enable it, the Predecessor column must be included on the New or Edit form. See Column Visibility Settings.
- Milestone dates can be changed by dragging the milestone directly in the Gantt Chart.
-
Drag and drop the start, finish, or entire task bar in the Gantt to update Task dates.
-
A number of actions are available in the Gantt's toolbar. These are:
- Refresh: Refreshes Gantt chart data.
 Expand All: Expands all summary tasks in the Gantt Chart.
 Collapse All: Collapses all summary tasks in the Gantt Chart.
- Zoom In: Narrows in on a date range moving from Years and Quarters, to Quarters and Months, to Months and Weeks, to Weeks and Days.
- Zoom Out: Widens out from a date range moving from Weeks and Days, to Months and Weeks, to Quarters and Months, to Years and Quarters.
 Add Timespan Left: To drag the earliest Start date in your Gantt to an earlier date, add timespans to the left and then drag the task to the earlier date.
 Add Timespan Right: To drag the latest Finish date in your Gantt to a later date, add timespans to the right and then drag the task to the later date.
 Critical Path: Displays the longest sequence of tasks that must be
finished on schedule in order to complete the entire project on schedule.
Critical Path: Displays the longest sequence of tasks that must be
finished on schedule in order to complete the entire project on schedule.
Note: A milestone task that has a duration greater than zero will automatically include lag and will not display as part of the critical path.
-
 Calculate Schedule: When you select the Calculate Schedule action the task schedule and
project metrics are both recalculated; the project metrics recalculation happens in the background to help improve performance.
Calculate Schedule: When you select the Calculate Schedule action the task schedule and
project metrics are both recalculated; the project metrics recalculation happens in the background to help improve performance.
Note: The Calculate Schedule action will not be displayed if the Task Scheduler is not activated.
Configuring the Gantt Chart Web Part
To configure:
- Click on the information icon to open the ribbon.
- Click Configure Gantt Chart Settings then click one of the options and click OK.
Note: Having more than one Gantt Chart web part on a page is not recommended. Having two Gantt Chart web parts side-by-side on a page is not supported.
Gantt Data Source
Data Source
The Gantt Chart web part supports the following Data Sources:
-
Project Cache
The Project Cache is designed primarily to speed up the loading of cross-site project reports that report across multiple sites. By default the Project Cache All items filter is chosen, but you can filter the project items displayed by any of the three out-of-the-box views: All Projects, Open Projects and My Projects or by using CAML. This option appears in data sources if the Project Cache is activated, (which it is by default out-of-the-box).The Gantt Scope can be set to report on Current Site only, or the Current Site and all its sub-sites. When in a Portfolio reporting site the only option will be Current Site.
-
Project Tasks
By default all items in Project Tasks lists are shown, but you can filter the project task items displayed by using one of the included views, or with CAML. The default sorting order is based on the sort setting of the active view or CAML filter; if no sort setting is specified, the sort order will be by task order number.Filter
There are three options:
-
All items
This includes all items from the selected list or library. -
Items in this view
This uses the filtering from the selected view in the selected list or library. If there is no filtering specified in the selected view all items are included. -
Specify filter (CAML)
This allows you to write your own CAML filter and insert the code.
-
Web Part Settings
Title
Enter a title for the web part.
Chrome Type
Chrome types available are: Default, Border Only, None, Title and Border, and Title Only.
Gantt Appearance
Height
You can set the height of the Gantt Chart by inputting a pixel value. The default height is 450 pixels. You cannot set the height below 300 pixels.
Tip: The height should not be set to more than the typical screen size. This can cause the column heading to scroll off the top page.
Options
Show Today Line: You can choose to display a Today Line in the Gantt Chart. The Gantt Chart will automatically zoom to fit the Today Line data in the display area.
Gantt Data Binding
Project Task Hierarchy Gantt
Enable Editing
If the Data Source is a Project Tasks list, then options to edit the tasks will be available. If Task Scheduling is enabled in the select Project Tasks list, then further options are available. The settings available are:
- Display Calculate Schedule: will include a Calculate Schedule button on the Gantt toolbar. This allows single-click Calculation of the Schedule. This option is only available if Task Scheduling is enabled in the selected Project Tasks list.
- Enable Editing: allow users with the correct permission to drag and drop dates and tasks to update their dates. Selecting this option disables the Gantt Columns section.
-
Calculate Schedule after dragging/dropping dates, Predecessors, or % Complete on the Gantt chart: will automatically Calculate the Project Tasks list schedule after each edit.
This can be useful as you schedule is always up to date. However, it is a slower operation than a simple edit and therefore may not be preferred.
This option is only available if Task Scheduling is enabled in the Project Tasks list.
Note: Calculate Schedule runs immediately after updating the Task. The list could have workflows which are also triggered to run at the same time that also update the Task. If this happens, an error will appear warning of a Save Conflict.
As a workaround you can either, modify your workflow or, turn off 'Calculate Schedule after dragging/dropping any Task date'.
All Gantts
Gantt Columns
Selecting the Enable Editing option for Project Task lists disables the Gantt Columns section.
Otherwise, select the columns to be represented in the Gantt Chart timeline:
-
Start Date
Select the date column to be used as the start date. This field is required. -
Finish Date
Select the date column to be used as the finish date. This field is required. -
Percent Complete
Select the column to be used as the Percent Complete column. This field is optional.
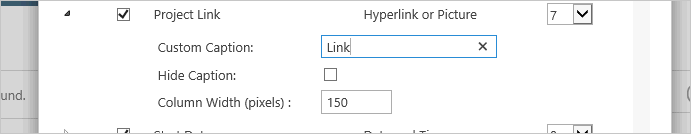
Column Settings
All Gantts
To configure the columns displayed in the Gantt, select the columns to be included and the order in which you want them to appear.
For each column, you can also set custom properties:
-
Custom Caption
Change text heading of the column. Some icon columns do not allow a custom caption. -
Caption Visibility
Hide or show the text heading of the column. -
Column Width
Set the width of the column in pixels. For columns displaying icons, 30 pixels is the recommended width.
Project Task Hierarchy Gantt
The Project Task Hierarchy Gantt has the following additional Column Settings:
Link Column Settings
- Link Column allows you to configure which column can be clicked on to open items.
-
Open the Link in a options include:
-
Dialog
Selecting Dialog means links will open items in the pop-up dialog.
This means you can view and edit individual list items and stay in the context of the page or report you are on. -
Note: If you delete an item from a Dialog you will be brought to the List the item was deleted from, and out of the current page.
-
Same Window/Tab
Link will open in the same browser tab (or window) as the report. -
New Window/Tab Once Only
Link will open in the same separate browser tab (or window). -
New Window/Tab Each Time
Link will open in a new browser tab (or window) every time.
-
Dialog
-
Refresh on Update refreshes the page when an item opened in a Dialog is saved.
This only applies to items saved from a Dialog.
This will refresh the Gantt Chart web part only.
It is recommended to turn this Refresh setting On. - Disable Link Column: turns off the link to the item from the Gantt chart's columns.
Sort
Project Gantt
This applies when configuring for the Project Cache data source only.
Select up to four sort columns and specify either Ascending or Descending sort order for each column. This sort setting will be used as the default each time the page is refreshed.
The columns within the Gantt can also be sorted by clicking on a column's heading. Ctrl-Click a column heading for multi-column sorting. This type of sort will only remain in place while the page is open. Refresh the Gantt to return to the default sort order.
Group By
Project Gantt
This applies when configuring for the Project Cache data source only.
Configure the groupings as follows:
-
Select the columns to group by, up to a maximum of 4 groups.
-
Select the sort direction within the grouping; this can be either ascending or descending.
-
Select whether you want each group to be collapsed or expanded by default.
-
Note: The following column types cannot be used for grouping:
- Hyperlink or Picture columns
- Multiple lines of text columns
- Lookup or Choice columns that allow multiple selections
Person or Group columns that allow multiple selections can be used when grouping, so long as only one multi-value Person or Group column is used.
Troubleshooting the Gantt Chart
When using the Gantt Chart you may see the following issues.
Predecessor links or rows do not align correctly
Issue
Gantt Chart rows go out of alignment with the data rows, or predecessor links go out of alignment with the task bars.
Root Cause
This can be caused by a combination of browser zoom factor and screen resolution.
For example, zooming to 90% in a browser on a lower resolution laptop screen.
Resolution
Reset the zoom factor to 100% (Ctrl-0).
Save Conflict
Issue
An error appears after updating a Task as follows:
Error updating Task : task_name when calculating schedule.
Exception : Save Conflict. Your changes conflict with those made concurrently by another user.
If you want your changes to be applied, click Back in your Web browser, refresh the page, and resubmit your changes.
Root Cause
It is likely that the 'Calculate Schedule after dragging/dropping any Task date' setting is turn on, and a workflow is also enabled that updates Tasks.
Resolution
Either modify your workflow or turn off 'Calculate Schedule after dragging/dropping any Task date'.