Metric History Chart
- Configure the Metric History Chart
- Metric History Chart Configuration Settings
The Metric History Chart web part displays the version history of up to ten number metric items from the Metrics list in a configurable chart.
The Metric History Chart does not support Date Metrics. See the Metric Scorecard for a web part that supports both.
Click here to learn how to add a web part to a BrightWork web part page.
Tip! If you need to refresh the Metric History chart, you can do it by using the  Ribbon action.
Configure the Metric History Chart
To configure the Metric History Chart web part:
- Click the menu
 on the chart.
 - Click Configure Chart.
Tip! Another way to configure the Metric History Chart is to click in the title of the Metric History Chart web part to expose the ribbon. Click the Metric History Chart ribbon tab and then click Configure Metric History Chart Settings.
Web Part Settings
Title
Enter a title for the report.
Chrome Type
Select a chrome type for the report:
- Default
- Border Only
- None
- Title and Border
- Title Only
Chart Type
Select a chart type:
- Bar
- Column
- Line
- Spline
- Step Line
Note: Custom formatting of Dates, Number or Currency columns are not supported in charts.
Chart Appearance
-
Chart Theme
By default, charts use the local SharePoint theme to designate a color scheme for the Y-Axis columns; however, you can over-ride this and select a custom theme for the chart.Chart Theme
Y-Axis Settings
Col 1
Col 2
Col 3
Col 4
Col 5
Col 6
Col 7
Col 8
Col 9
Col 10
Default Blue Scale Bright 1 Bright 2 Excel Grey Scale Primary Traffic Light Spectrum Pastel Dynamic -
Chart Width
Specify a width for the chart. -
Chart Height
Specify a height for the chart. -
Show chart border
Select this option to show the chart border. -
Chart Display
There are three options:- Show as standard
- Show as polar
- Show in 3D
Tip! 'Show as standard' is the default option for displaying charts. A chart can be shown in either 3D and standard or polar and standard, but never 3D and polar.
Note: The Polar option for Metric History Charts are only available in the following charts: Column, Bar, Spline and Line. The options to 'Pan' and 'Zoom' are also not available on Polar charts.
The 3D options for Metric History Charts are only available on the following charts: Column and Bar.
-
X-Axis Options
Select this option to format for readability. When a chart has lots of data, the format for readability option enables clearer content as shown in the image below.
Custom theme selection does not over-ride custom color settings applied in the Chart Data Binding section.
Note: Chart height and width settings of below 100px will be ignored.
Chart Data Binding
Select the columns to supply the data to render.
X-Axis Settings
-
Interval
Select the time units to use as data points:- Days
- Weeks
- Months
- Quarters
- Years
-
Show
Select whether to show All Data or select Last and specify the number of Intervals to show in the past.Selecting All Data and a frequent interval like Days could make the chart unreadable.
-
Interval Value Formula
Select the grouping formula:- Minimum
- Maximum
- First
- Last
-
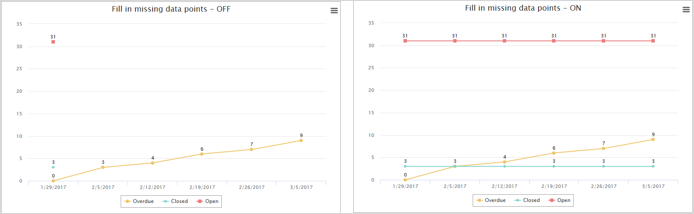
Fill in missing data points
Select this if you want the chart to fill in any missing data points.To understand this setting, examine the two images below. Both of these charts are configured exactly the same, except for the 'Fill in missing data points' setting.
When 'Fill in missing data points' is enabled, it creates a data point for every interval, even if the data has not changed. When 'Fill in missing data points' is not enabled, gaps will appear where there is no data.
Y-Axis Settings
You can plot up to ten metrics on the one chart. For each metric you can show the Metric Value and the Target Value. You can also enter a legend and select a color for the value being charted.
-
Select the Metric ID
-
Select Show Metric Value and/or Show Target Value and enter a legend and select a color
Entering the Legend and selecting the color are optional.
If you do not enter a Legend, the Metric ID will be displayed.
If you do not select a color, the selected chart theme will be used to assign colors.
Tip! You can reorder the placement of Y-Axis columns by dragging and dropping any of the columns on the chart configuration screen.
Chart Title and Legend
Chart Title
-
Show Chart Title
Select to enable the display of a chart title -
Title
Enter a title for the chart -
Location
Select the preferred location for the chart title -
Alignment
Select the preferred alignment of the chart title
Chart Legend
-
Show Chart Legend
Select to display a legend that illustrates the selected Y-Axis columns -
Location
Select the preferred location for the chart legend -
Alignment
Select the preferred alignment of the chart legend
Chart Data Display Settings
Chart Data Labels:
-
Show data labels
Unselect this if you do not want to include data labels in chart data results