Configure Resource Usage Reports
This topic describes how to configure BrightWork Reporter Resource Usage reports, including how to select the report you want to display.
The most commonly used configuration settings for Resource Usage reports are available via the Shared Settings section on the Reporter ribbon. The Shared Settings section also includes a report filter dialog that is not available on the Reporter settings page.
You can also create a personal report via the Reporter ribbon.
The reports supplied with BrightWork Reporter are setup to report on the lists supplied with BrightWork and SharePoint. If columns are added to these lists you can add these columns to reports using the Report Editor. This will enable reporting on these columns.
Once you have configured your report, you can save it as a web part template to save you having to repeat your effort elsewhere.
Configure a Report
To configure a report:
- Click on the information icon
 of the report to open the Reporter ribbon.
 - Click Configure Reporter Settings then click one of the options and click OK.
Report Settings
Data Source
Select the data source.
Tip! Selecting a new Data Source, even temporarily, means that all custom report configuration settings could be lost. To avoid having to repeat any configuration effort, save reports as web part templates.
-
Work Cache
The Work Cache is primarily designed as an alternative to open work and issue reports that report across multiple sites. By default, all open items in the Work Cache are shown but you can filter the work items by any of the three out-of-the-box views: Open Work, My Work and Issues. This option only appears in the list of data sources if the Work Cache is activated. -
Project Cache
The Project Cache is designed primarily to speed up the loading of cross-site Project reports that report across multiple sites. By default, all items in the Project Cache are shown but you can filter the project items displayed by any of the three out-of-the-box views: All Projects, Open Projects and My Projects. This option only appears in the list of data sources if the Project Cache is activated. -
Project Status Report Cache
The Project Status Report Cache is primarily designed as an alternative to 'project status report' reports that report across multiple sites. By default, only the current project status report for a list in the Project Status Report Cache is shown but you can change this by selecting the All Project Status Report view. This option only appears in the list of data sources if the Project Status Report Cache is activated. -
Reporter Library
The BrightWork Reporter Library is where Report Definition files can be created and modified. -
Server Gallery
The BrightWork Server Gallery is a read-only gallery of Report Definition files. -
Custom Location
Custom Report Location is where you can reference Report Definition files in locations other than the two above.
Report Scope
Define the target site and specify whether or not to include the target site's subsites in the report.
-
Current Site
Selecting this option means that only the current site will be included in the report. -
Specified Site
This option is for specifying the SharePoint site to report off. Selecting this option enables the Specified Site field. The URL you supply must be server relative, for example: /sites/SiteName. -
Specified Site(s)
This option is for specifying a list of SharePoint sites to report off. Selecting this option enables the Multiple Site Locations field for you to enter site URLs.Note: Use a ; to separate the sites.
The URLs can be server relative (for example: /sites/SiteName) or fully qualified (for example: http://www.contoso.com/sites/SiteName).
Fully qualified URLs must point to sites on the same server as the site the report is running in.
You can also specify a single site here - the Specified Site option above is being maintained for legacy reasons.
-
Report XML
Selecting this option means the scope is defined in the report file - see Add or Edit a Query Source for more information.This option is not available for BrightWork Server Gallery reports.
Report Scope Location
Enter the location of the specified web that you want to report off.
This is only necessary if Specified Site is selected from the Report Scope menu.
Report Type
Select the Report Type:
Note: The Gantt Report and Resource Usage Report types will only appear if valid data exists to render the report. For example, if only one date column exists a Gantt or Resource report cannot be rendered.
-
Chart Report
-
Gantt Report
-
List Item Report
-
Resource Usage Report
Web Part Settings
Title
Enter a title for the report.
Chrome Type
Chrome types available are: Default, Border Only, None, Title and Border, and Title Only.
Rendering and Performance
Note: The Rendering and Performance section is not available when Project Cache or Work Cache is selected as the Data Source.
Site Filters
Select Enable to switch on the site filters defined in the Report Definition.
Site Filters are a way of excluding certain sites from being queried by BrightWork Reporter (for example, the default site filters ensure that BrightWork project sites that have a Status of (3) Completed and/or where Exclude from Reports is selected on the Project Statement are excluded from most reports).
You should only disable site filters if you need to do so on a case by case basis. If you wish to remove a site filter from all instances of a report, you should do so via the Report Editor.
Retention Duration
Select Enable and enter the number of seconds to retain the report's data.
A Retention Duration of 5 seconds for example, means that if the page is revisited within 5 seconds BrightWork Reporter will reuse the data. This is especially useful if there is a lot of data in the report, as it can take a few seconds to render first time. The report is retained on the server on a per user basis, up to a maximum of 3600 seconds (i.e. 1 hour).
Click the Refresh button on the Reporter ribbon to override the Retention Duration setting and display the most up-to-date content.
Site Name Caption
The captions (column titles) for all columns except the Site Name and List Name are specified in the report definition. If you would like to have a different title for Site Name in the displayed report, enter it here. This will not change the captions in the tool pane. Note: Custom Caption settings in the Columns section override this setting.
List Name Caption
The captions (column titles) for all columns except the Site Name and List Name are specified in the report definition. If you would like to have a different title for List Name in the displayed report, enter it here. This will not change the captions in the tool pane. Note: Custom Caption settings in the Columns section override this setting.
Show Report Description
Choose whether you want the report description to display: Collapsed, Expanded or None.
Show Report Errors
Choose whether you want the report errors to display: Collapsed, Expanded or None.
BrightWork Reporter error messages can be very useful for debugging purposes, if you are creating your own reports or adding lists to your sites.
Report Profiler
The Report Profiler displays a report on all the sites and lists queried by an instance of a report, including how long individual sites and lists take to query.
Resource Report Data Binding
Date Settings
-
Start Date Column:
Select a date column to use as the start date (e.g. Planned Start). -
Finish Date Column:
Select a date column to use as the end date (e.g. Planned Finish).
Work Allocation
-
Work Column
Select a number column to use as the work unit. This should only be a column where work effort is entered in hours. -
Show work allocation as a percentage
Select this if you want the allocated work to be displayed as a percentage of the available time specified in the default hours per day field. -
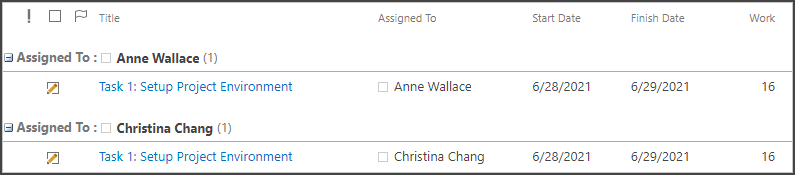
Apportion Work evenly
Apportion Work evenly when grouping by a Person or Group column which allows multiple selections.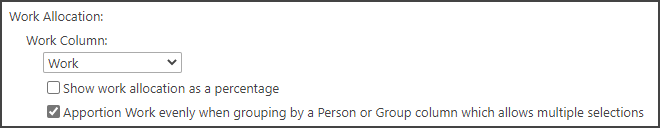
When grouping by a multi-value Person or Group column, Work will be apportioned equally across the different people. For example, Task 1 in this screenshot has Work of 32 hours that is being equally apportioned between two people.
Without Apportioning of values, the report would have the following Work and Cost values.
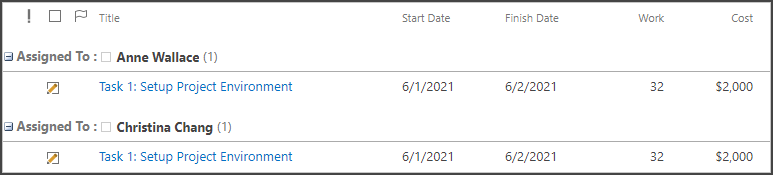
See this topic for more information on setting up apportionment.
Calendar Settings
This section displays information on the source of the Active Project Calendar and Regional Settings that are used to calculate and render the report.
-
Specify custom 'Working Hours per Day' for this report
Optionally select and specify the number of hours work, per working day, to use in calculating the data if you want to over-ride the setting specified in the BrightWork Settings page
Column Settings
Select the columns to be included in the report and the order in which you want them to appear.
For each column, you can also set custom properties:
- Custom Caption (not available for icon columns)
- Caption Visibility
- Column Width
Note: Custom column properties are lost if the column is removed from the report.
If you wish to use a custom column title for grouping purposes, the column must also be added to the report.
Columns listed here may not exist in all lists.
Link Column Settings
Enable or disable the link column; when enabled, the following settings become available:
Link Column
Select the column you want to use to link to the individual list items. When a user clicks on the link the item will open in read mode.
Open the Link in a:
Select how you want the links in reports to behave:
-
Dialog
Selecting Dialog means links will open items in the pop-up dialog.
This means you can view and edit individual list items and stay in the context of the page or report you are on. Most importantly, this works across sites and lists, meaning you can edit items in different lists and sites from the one location in a site collection.Select Refresh on Update so that when an item is saved from a Dialog the report is automatically refreshed.
The Refresh option is available when the:- Dialog option is selected for the 'Open the Link in a' option
- Reporter Library, Server Gallery, or Custom Location is a Data Source (caches are not supported)
- Retention Duration is not enabled in the Rendering and Performance section
-
Same Window/Tab
Link will open in the same browser tab (or window) as the report. -
New Window/Tab Once Only
Link will open in the same separate browser tab (or window). -
New Window/Tab Each Time
Link will open in a new browser tab (or window) every time.
Sort
Select the column(s) you want to use to sort the items returned (i.e. the order in which the items are displayed in the report) and the direction you want them to be sorted.
These column-types cannot be used for sorting: Multi-value, URL, Note, and Icon.
Group By
Configure the groupings as follows:
-
Select the columns to group by, up to a maximum of 4 groups
-
Select the sort direction within the grouping, and this can be either ascending or descending
-
Select whether you want each group to be collapsed or expanded by default
-
Show Presence: If the column type is Person or Group, Presence can be turned on or off on the report.
Note: turning off Presence can speed up large reports -
Note: the following column types cannot be used for grouping:
- Hyperlink or Picture columns
- Multiple lines of text columns
- Lookup or Choice columns that allow multiple selections
Person or Group columns that allow multiple selections can be used when grouping, so long as only one multi-value Person or Group column is used.
Timescales
-
Timescale
The timescales you can use are: Top or Bottom. -
Non working time:
Select to include non-working time in the display of the report. This option is only available if days is selected in the bottom timescale.
Note: At least one start date and one finish date must exist in the report in order for the Timescale to be set.
Time Window Settings
Time Window
-
All Data
This shows all items returned from the earliest date found to the latest date found.
Select this setting with caution as it could take a long time to load and slow down the rendering of the report.
-
From Today
Specify the number of days, weeks or months to use to create the time window. -
Note: The narrower the time window the quicker the report will render.
-
Looking Back:
Select the time period the report should look back. -
Looking Forward:
Select the time period the report should look forward.
-
Resource Report Display Settings
-
Allocation Theme:
Select from the following themes to default the colors for a resource report. The threshold values indicate the color that will appear when the % Allocation is within the threshold range. For example, if the 'Amber' theme is selected and the person's time is over 110% allocated, the Hours or % Allocation value will appear with a red background in the report.
The default allocation theme is 'Green Light'.
| Theme | Threshold | |||||||||||||
| 0% | >0% <10% | >=10% <20% | >=20% <30% | >=30% <40% | >=40% <50% | >=50% <60% | >=60% <70% | >=70% <80% | >=80% <90% | >=90% <=100% | >100% <=110% | >110% | ||
| Amber | ||||||||||||||
| Amber Light | ||||||||||||||
| Blue | ||||||||||||||
| Blue Light | ||||||||||||||
| Gray | ||||||||||||||
| Gray Light | ||||||||||||||
| Green | ||||||||||||||
| Green Light (Default) | ||||||||||||||
| No Theme | ||||||||||||||
-
Over-allocated items:
-
Highlight work over-allocation:
To override the over-allocation color, you can select a color highlight which will show when the total hours per day are more than those specified in the Working Hours per Day field. -
Over-allocated color:
Specify a color to use to indicate over-allocation. Note this is not necessary when using an Allocation Theme. It may however be useful if you wish to override the theme's over-allocation color. -
Specify custom Over-allocation unit value:
Select to specify a unit value for the selected grouping(s). The unit value should equate to the number of members in the grouping. This will divide the work allocated to groupings by this number to determine if the grouping is over-allocated. You might do this when a grouping includes a number of resources and you want to see if the grouping as a whole is over-allocated.
-
-
Font Size:
-
Choose a font size. Note that the default font size is Medium.
-
-
Allocation Data:
-
Only render items with allocation data:
Select to exclude items that do not have sufficient data to create a calculation (e.g. data in the selected Start Date Column, Finish Date Column and Work Column).
-
-
Report Row Styles:
-
Emphasise alternating rows.
-