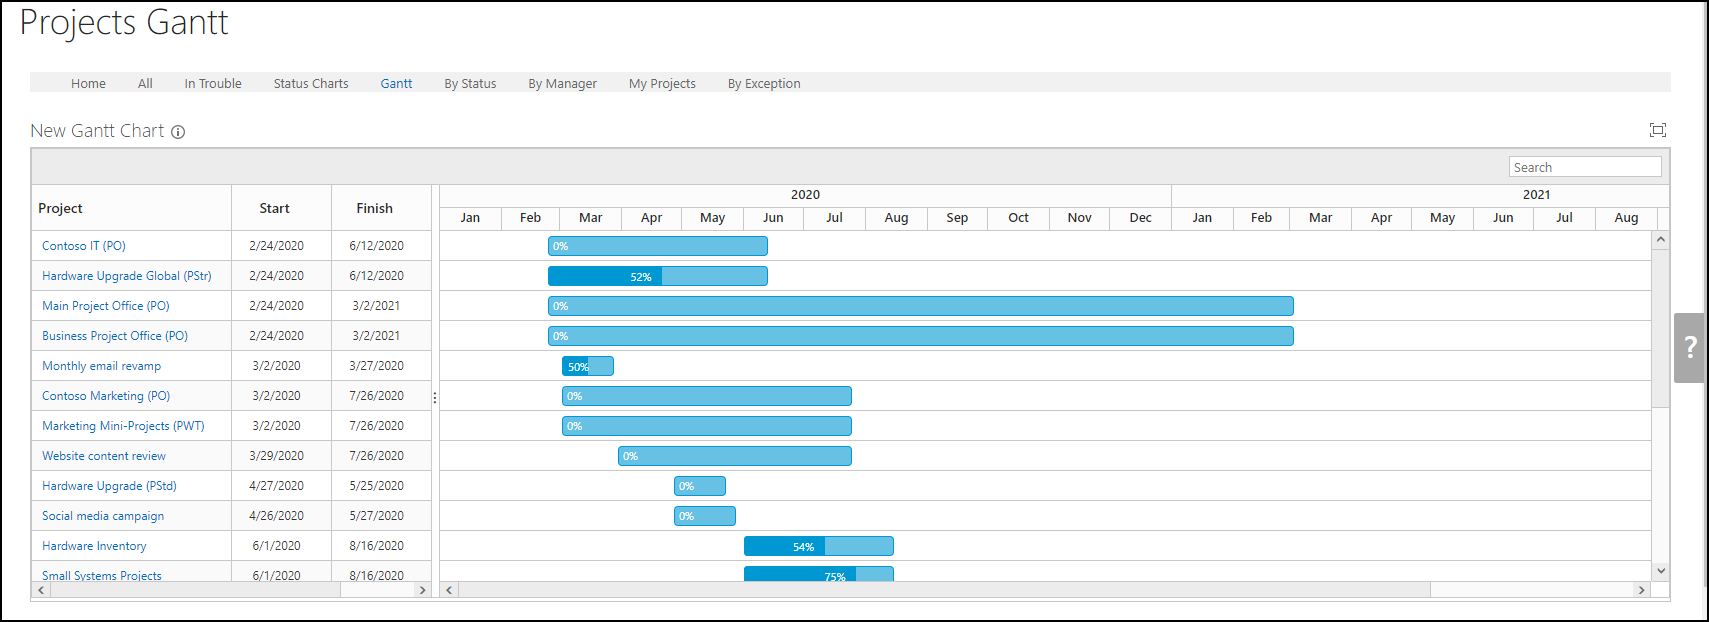
Gantt Chart web part
The Gantt Chart web part is a modern Gantt chart with interactive features, intended to eventually replace the current BrightWork Gantt reports.

Using the Gantt Chart web part
The Gantt Chart web part supports the following:
- Column widths can be dragged to expand or narrow the column.
- Column splitter can be dragged left and right to hide or show columns.
- Column can be sorted by clicking on the column's heading. Ctrl-Click a column heading for multi-column sorting.
- Search of Gantt content including; project, dates, and % complete.
- Full screen view by clicking this icon:
 . Hit the Esc key to exit this mode.
 - Refresh of the web part is available from the web part Ribbon. Click on the information icon
 to see the ribbon.
Notes:
-
We recommended one Gantt Chart web part per page. This ensures all the features are available. For instance,
full screen view
 will not be available when there is more than one Gantt Chart web part on a page.
-
Full screen view
 is not available in Internet Explorer browsers.
Configuring Gantt Chart web part
To configure:
- Click on the information icon
 to open the ribbon.
 - Click Configure Gantt Chart Settings then click one of the options and click OK.
Gantt Data Source
Data Source
The Gantt Chart web part supports the following Data Sources:
- Project Cache
Note: Other Data Sources will be added over time.
The Data Source can be filtered using views or by using CAML.
-
Project Cache
The Project Cache is designed primarily to speed up the loading of cross-site Project reports that report across multiple sites. By default, all items in the Project Cache are shown but you can filter the project items displayed by any of the three out-of-the-box views: All Projects, Open Projects and My Projects or by using CAML. This option appears in data sources if the Project Cache is activated, which it is out of the box.
Gantt Scope
The Gantt Scope can be set to report on Current Site only, or the Current Site and all its sub-sites.
Web Part Settings
Title
Enter a title for the web part.
Chrome Type
Chrome types available are: Default, Border Only, None, Title and Border, and Title Only.
Data Binding
Gantt Columns
Select the columns to be represented in the Gantt Chart's timeline:
-
Start Date
Select the date column to be used as the start date. This field is required. -
Finish Date
Select the date column to be used as the finish date. This field is required. -
Percent Complete
Select the column to be used as the Percent Complete column.This field is optional. -
Milestone Flag
Select a Yes/No column to enable the milestone diamond visual indicator. This field is optional.
Column Settings
- Project: project title and links to the project using the Project Link logic.
- Start: project start date which is calculated in the project cache.
- Finish: project finish date which is calculated in the project cache.
- % Complete: project percentage complete.
To configure the columns displayed in the Gantt, select the columns to be included and the order in which you want them to appear.
For each column, you can also set custom properties:
-
Custom Caption
Change text heading of the column. -
Caption Visibility
Hide or show the text heading of the column. -
Column Width
Set the width of the column in pixels. If this is not set the web part will try to display the columns using 'best fit' approach.

Note: Not all columns in the Project Cache are available. The following columns types are; Project Link, Dates, Numbers, Currency, People/Groups (i.e. users), Choice, Text, and Yes/No.
Sort
Select up to four sort columns. Specify either Ascending or Descending sort order for each column.
This sorting is the default sorting used each time the page is opened. The columns within the Gantt can also be sorted by clicking on the column's heading. Ctrl-Click a column heading for multi-column sorting. This type of sort will only remain in place while the page is open.