Adjust BrightWork Timer Job
Once activated, a BrightWork Timer Job runs at specific intervals on the server. You can adjust this via SharePoint Central Administration.
This task requires administrator access to the server and some knowledge administering SharePoint.
If you want to manually run a timer job, you can click Run Now.
While you might want to adjust the frequency of certain timer jobs, it is recommended that the timer jobs run in the following sequence:
- Task Scheduling (Daily - default time 12:00am to 12:30am)
- Project Metrics Refresh (Daily - default time 1:30am to 2:00am)
- Project Status Report Cache Refresh (Daily - default time 2:30am to 3:00am)
- Project Cache Refresh (Daily - default time 3:00am to 3:30am)
- Work Cache Refresh (Daily - default time 3:30am to 4:30am)
- Scheduled Email (Daily - default time 4:30am to 5:00am)
- User Access Report (Monthly - default is the 1st of the month at 12:00am)
- Work Cache Update (Daily - runs every 15 minutes)
Tip! The User Access Report may not be needed very often. It might for instance be needed once a year for a user audit. In this case it is recommended to Disable the timer job when it is not needed and Enable it and select Run Now to create a report on demand.
Adjust the BrightWork Timer Job Schedule
- Log in to Central Administration and click Monitoring on the Quick Launch.
- Click Review job definitions.
- Click the BrightWork timer job you want to adjust.
- Make your adjustments and click OK. Click Run now to run the job right away.
Note: Depending on the size of your BrightWork environment you may need to allow more time for certain timer jobs to finish. The Work Cache Refresh is a prime example in this case.
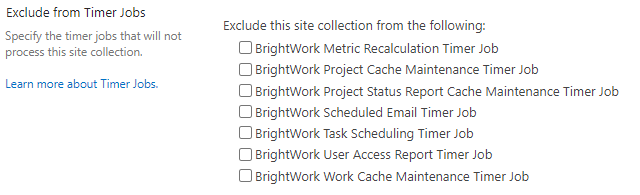
Exclude Site Collections from Specified BrightWork Timer Jobs
Timer jobs can skip an entire site collection when processing if the appropriate checkbox is selected at the root of the site collection.
To exclude a site collection from specified timer jobs:
- Navigate to the site collection's root.
- Click Site Settings | BrightWork Settings.
- In the section Exclude from Timer Jobs check the box for any timer job you would like to be skipped for the site collection.
- Click OK.
BrightWork Timer Job ULS Logs
All BrightWork timer jobs will record the following information to SharePoint ULS logs:
- The time it takes to process each site collection.
The Metric Recalculation Timer Job will also record the following additional information to SharePoint ULS logs - see ULS log Area "BrightWork" and Category "Metrics":
- The time it takes to process each site collection.
- The time it takes to process each Metrics list.
- The time it takes to process each metric in milliseconds.
View BrightWork Timer Job ULS Logs
- Access SharePoint Central Administration.
- On the Configure Diagnostic Logging page, set the trace log level to Verbose.
- Expand BrightWork and check the trace levels.
- If you need to set the trace level to Verbose, check the box beside BrightWork and select Verbose in the Least Critical Event to Report to the Trace Log dropdown and then click OK.
- The folder location of the log files is also configured on the Diagnostic Logging page.
- When you open the log file in your SharePoint ULS log viewer, select BrightWork to filter the Area.
- Select the relevant Category for filtering, i.e., Metrics, and view the associated log entries.
Tip! When filtering categories in your ULS log viewer, always include the General category along with the specific subcategory you're interested in viewing.
Diagnose Timer Job Issues with ULS Logs
Viewing BrightWork ULS log entries using your preferred ULS log viewer can be very useful for diagnosing timer job performance related issues. For example:
-
If a timer job appears to be taking longer than expected to complete, check the elapsed time of the entire timer job.

-
You can check the elapsed time of a specific element of the timer job, e.g., the recalculation of a specific metric, to understand why the entire related job is taking longer than expected.
